了解有关 Spring Boot 默认指标及其来源的更多信息。
您是否注意到 Spring Boot 和 Micrometer 为您的应用生成的所有默认指标? 如果没有 - 您可以将 actuator 依赖项添加到项目中,然后点击 / actuator / metrics 端点,在那里您将找到有关 JVM 、进程、Tomcat、流量等的有用信息。 然后,添加一些缓存,数据源 或 JPA 依赖项,甚至会出现更多指标。如果您想知道它们是如何结束的,我们可以在哪里找到关于它们所描述的参数的解释,那么这篇文章就是为您准备的。
显示指标
为了让它井然有序,让我们从如何在 Spring Boot 应用程序中显示指标开始。如果您已经知道了,可以跳过这一部分。
Spring Boot中的指标由 micrometer.io 处理。但是,如果您使用 actuator ,则不需要向项目添加 micrometer 依赖项,因为 actuator 已经依赖于它。即使您对它提供的端点不感兴趣,也希望您使用 actuator ,因为这是通过其 AutoConfigurations 注册许多指标的模块。稍后我们会详细讨论。
因此,首先,只需将执行器依赖项添加到项目中(这里是 build.gradle.kts )
dependencies {
    implementation("org.springframework.boot:spring-boot-starter-actuator")
}
并在执行器端点中显示指标名称,点击 http://localhost:8080/actuator/metrics.
{
  "names": [
    "jvm.threads.states",
    "process.files.max",
    "jvm.memory.used",
    "jvm.gc.memory.promoted",
    "jvm.memory.max",
    "system.load.average.1m",
    ...
  ]
}
然后,要查看详细信息,请在 URL 路径中添加指标名称,例如: http://localhost:8080/actuator/metrics/system.cpu.count.
{
  "name": "system.cpu.count",
  "description": "The number of processors available to the Java virtual machine",
  "baseUnit": null,
  "measurements": [
    {
      "statistic": "VALUE",
      "value": 8
    }
  ],
  "availableTags": [
  ]
}
通过提供特定的仪表注册表,可以定期将这些指标发送到您选择的指标系统( Prometheus,New Relic,CloudWatch,Graphite 等)。 让我们用最简单的注册表来做 - LoggingMeterRegistry,它只是定期记录所有指标。
@Configuration
class MetricsConfig {
    @Bean
    LoggingMeterRegistry loggingMeterRegistry() {
        return new LoggingMeterRegistry();
    }
}
现在,指标也显示在日志中:
2019-07-17 11:07:09.406  INFO 91283 --- [trics-publisher] i.m.c.i.logging.LoggingMeterRegistry     : jvm.buffer.count{id=direct} value=0 buffers
2019-07-17 11:07:09.406  INFO 91283 --- [trics-publisher] i.m.c.i.logging.LoggingMeterRegistry     : jvm.buffer.count{id=mapped} value=0 buffers
2019-07-17 11:07:09.406  INFO 91283 --- [trics-publisher] i.m.c.i.logging.LoggingMeterRegistry     : jvm.buffer.memory.used{id=direct} value=0 B
2019-07-17 11:07:09.406  INFO 91283 --- [trics-publisher] i.m.c.i.logging.LoggingMeterRegistry     : jvm.buffer.memory.used{id=mapped} value=0 B
2019-07-17 11:07:09.408  INFO 91283 --- [trics-publisher] i.m.c.i.logging.LoggingMeterRegistry     : jvm.classes.loaded{} value=8530 classes
2019-07-17 11:07:09.408  INFO 91283 --- [trics-publisher] i.m.c.i.logging.LoggingMeterRegistry     : jvm.gc.live.data.size{} value=0 B
2019-07-17 11:07:09.408  INFO 91283 --- [trics-publisher] i.m.c.i.logging.LoggingMeterRegistry     : jvm.gc.max.data.size{} value=0 B
2019-07-17 11:07:09.410  INFO 91283 --- [trics-publisher] i.m.c.i.logging.LoggingMeterRegistry     : jvm.memory.committed{area=nonheap,id=Compressed Class Space} value=6.25 MiB
2019-07-17 11:07:09.410  INFO 91283 --- [trics-publisher] i.m.c.i.logging.LoggingMeterRegistry     : jvm.memory.committed{area=heap,id=G1 Eden Space} value=168 MiB
...
指标供应
那么,如何提供这些指标呢?一个示例可能是 WebMvcMetricsFilter ,向所有 Spring Web MVC 端点添加性能指标 (http.server.requests metric) 。
但是这个例子很简单。当所有请求都由 Spring 框架处理时,在内部添加调用生成指标是没有必要的(只检查 WebMvcMetricsFilter.record() 方法)。
但是,如果您使用纯 ehcache 或 hibernate 或其他数据源,然后生成指标,情况又会如何呢?
那么 cache. * 指标呢,即使我 @Autowired 纯 net.sf.ehcache.Cache 也会生成?
那么 hibernate. * 指标呢,即使我 @Autowired 纯 org.hibernate.SessionFactory 也会生成?
然后, jvm.* , process.* , tomcat.* 等如何自动生成?
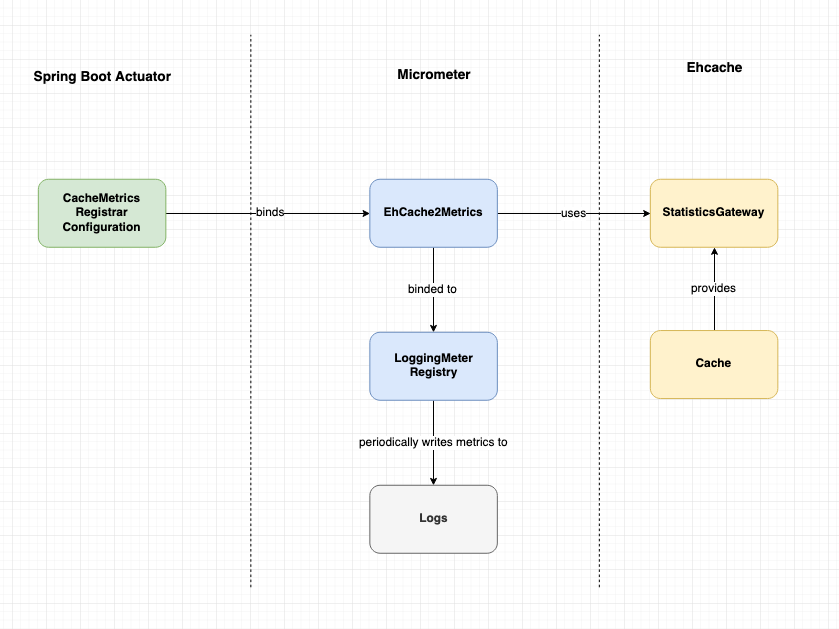
它似乎比人们想象的更简单,因为这些统计数据是由受监控的组件本身提供的。 有时,它将直接提供,例如cache.getStatistics() 为 EhCache 提供 StatisticsGateway ,或 sessionFactory.getStatistics() 为 Hibernate SessionFactory 提供 statistics 等等。
有时,这可以通过其他方式实现,比如托管 bean 。例如,将 RuntimeMXBean 用于 JVM process.* 指标以及 将(如GlobalRequestProcessor, Servlet 等) Tomcat mbeans 用于 tomcat. * 指标
为了访问这些统计数据并将其转换为特定指标,Micrometer 引入了 MeterBinder 的概念。
检查 MeterBinder implementation 层次结构,您将了解更多关于可用的指标组的信息。
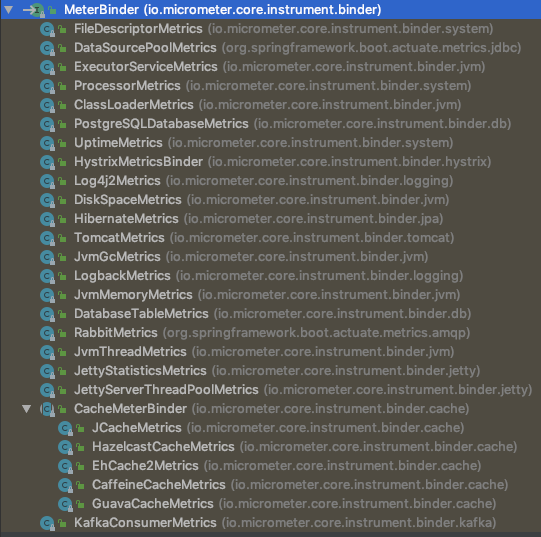
您也可以直接在 micrometer repo 上检查。
打开,例如, EhCache2Metrics ,您将找到 Ehcache 统计信息映射到特定 Micrometer 指标的内容和方式。
cache.size -> StatisticsGateway:getSize cache.gets{result=miss} -> StatisticsGateway:cacheMissCount cache.gets{result=hit} -> StatisticsGateway:cacheHitCount cache.puts -> StatisticsGateway:cachePutCount cache.evictions -> StatisticsGateway:cacheEvictedCount cache.remoteSize -> StatisticsGateway::getRemoteSize cache.removals -> StatisticsGateway::cacheRemoveCount cache.puts.added{result=added} -> StatisticsGateway::cachePutAddedCount cache.puts.added{result=updated} -> StatisticsGateway::cachePutAddedCount cache.misses{reason=expired} -> StatisticsGateway::cacheMissExpiredCount) cache.misses{reason=notFound} -> StatisticsGateway::cacheMissNotFoundCount) cache.xa.commits{result=readOnly} -> StatisticsGateway::xaCommitReadOnlyCount cache.xa.commits{result=exception} -> StatisticsGateway::xaCommitExceptionCount cache.xa.commits{result=committed} -> StatisticsGateway::xaCommitCommittedCount cache.xa.rollbacks{result=exception} -> StatisticsGateway::xaRollbackExceptionCount cache.xa.rollbacks{result=success} -> StatisticsGateway::xaRollbackSuccessCount cache.xa.recoveries{result=nothing} -> StatisticsGateway::xaRecoveryNothingCount cache.xa.recoveries{result=success} -> StatisticsGateway::xaRecoveryRecoveredCount cache.local.offheap.size -> StatisticsGateway::getLocalOffHeapSize) cache.local.heap.size -> StatisticsGateway::getLocalHeapSizeInBytes cache.local.disk.size -> StatisticsGateway::getLocalDiskSizeInBytes
注册 MeterBinders 是非常简单的,示例可以在 micrometer 文档 中被找到。
记住,您可以手动操作:
new ClassLoaderMetrics().bindTo(registry);
new JvmMemoryMetrics().bindTo(registry);
new EhCache2Metrics(cache, Tags.of("name", cache.getName())).bindTo(registry)
new TomcatMetrics(manager, tags).bindTo(registry)
...
或者,您可以使用 Spring Boot ,它会在引擎下为您做这件事。
正如我之前提到的,actuator 将提供许多 AutoConfiguration s 和 MetricsBinders ,只要添加给定的依赖项,它就会注册 MeterBinders 。
例如, TomcatMetricsBinder 将注册 TomcatMetrics (为您的嵌入式容器)。MeterRegistryConfigurer 将注册 JVM 、运行时间 和其他系统指标。
现在,假设您想在您的应用程序中使用 Ehcache 。 您可以添加两个依赖项:
    implementation("org.springframework.boot:spring-boot-starter-cache")
    implementation("net.sf.ehcache:ehcache")
然后注册缓存(您也可以通过 ehcache.xml 来实现)
  @Bean
    Cache playCache(EhCacheCacheManager cacheManager) {
        CacheConfiguration cacheConfiguration = new CacheConfiguration()
            .name(CACHE_NAME)
            .maxEntriesLocalHeap(MAX_ELEMENTS_IN_MEMORY);
        Cache cache = new Cache(cacheConfiguration);
        cacheManager.getCacheManager().addCache(cache);
        cacheManager.initializeCaches();
        return cache;
    }
现在, CacheMetricsRegistrarConfiguration 将通过 Spring 缓存管理器为每一个缓存管理注册 EhCache2Metrics 。
如果您不想使用 Spring 缓存管理,您也可以自己注册 EhCache2Metrics 。
现在,启动应用程序,您将看到其他 ehcache 指标。
2019-07-17 13:08:45.113  INFO 93052 --- [trics-publisher] i.m.c.i.logging.LoggingMeterRegistry     : cache.gets{cache=playCache,cacheManager=cacheManager,name=playCache,result=hit} throughput=12.95/s
2019-07-17 13:08:45.124  INFO 93052 --- [       Thread-4] i.m.c.i.logging.LoggingMeterRegistry     : cache.misses{cache=playCache,cacheManager=cacheManager,name=playCache,reason=notFound} throughput=3.7/s
2019-07-17 13:08:45.124  INFO 93052 --- [trics-publisher] i.m.c.i.logging.LoggingMeterRegistry     : cache.gets{cache=playCache,cacheManager=cacheManager,name=playCache,result=miss} throughput=3.7/s
2019-07-17 13:08:48.840  INFO 93052 --- [       Thread-4] i.m.c.i.logging.LoggingMeterRegistry     : cache.puts{cache=playCache,cacheManager=cacheManager,name=playCache} throughput=16.65/s
2019-07-17 13:08:48.840  INFO 93052 --- [trics-publisher] i.m.c.i.logging.LoggingMeterRegistry     : cache.misses{cache=playCache,cacheManager=cacheManager,name=playCache,reason=notFound} throughput=3.7/s
2019-07-17 13:08:48.841  INFO 93052 --- [trics-publisher] i.m.c.i.logging.LoggingMeterRegistry     : cache.puts{cache=playCache,cacheManager=cacheManager,name=playCache} throughput=16.65/s
2019-07-17 13:08:48.841  INFO 93052 --- [       Thread-4] i.m.c.i.logging.LoggingMeterRegistry     : cache.puts.added{cache=playCache,cacheManager=cacheManager,name=playCache,result=updated} throughput=0.116667/s
2019-07-17 13:08:48.841  INFO 93052 --- [trics-publisher] i.m.c.i.logging.LoggingMeterRegistry     : cache.puts.added{cache=playCache,cacheManager=cacheManager,name=playCache,result=updated} throughput=0.116667/s
2019-07-17 13:08:48.841  INFO 93052 --- [       Thread-4] i.m.c.i.logging.LoggingMeterRegistry     : cache.puts.added{cache=playCache,cacheManager=cacheManager,name=playCache,result=added} throughput=0.116667/s
2019-07-17 13:08:48.842  INFO 93052 --- [trics-publisher] i.m.c.i.logging.LoggingMeterRegistry     : cache.puts.added{cache=playCache,cacheManager=cacheManager,name=playCache,result=added} throughput=0.116667/s
2019-07-17 13:08:48.847  INFO 93052 --- [trics-publisher] i.m.c.i.logging.LoggingMeterRegistry     : cache.local.disk.size{cache=playCache,cacheManager=cacheManager,name=playCache} value=0 B
2019-07-17 13:08:48.847  INFO 93052 --- [       Thread-4] i.m.c.i.logging.LoggingMeterRegistry     : cache.local.disk.size{cache=playCache,cacheManager=cacheManager,name=playCache} value=0 B
2019-07-17 13:08:48.908  INFO 93052 --- [       Thread-4] i.m.c.i.logging.LoggingMeterRegistry     : cache.local.heap.size{cache=playCache,cacheManager=cacheManager,name=playCache} value=1.039062 KiB
2019-07-17 13:08:48.908  INFO 93052 --- [trics-publisher] i.m.c.i.logging.LoggingMeterRegistry     : cache.local.heap.size{cache=playCache,cacheManager=cacheManager,name=playCache} value=1.039062 KiB
2019-07-17 13:08:48.909  INFO 93052 --- [trics-publisher] i.m.c.i.logging.LoggingMeterRegistry     : cache.local.offheap.size{cache=playCache,cacheManager=cacheManager,name=playCache} value=0 B
2019-07-17 13:08:48.909  INFO 93052 --- [       Thread-4] i.m.c.i.logging.LoggingMeterRegistry     : cache.local.offheap.size{cache=playCache,cacheManager=cacheManager,name=playCache} value=0 B
2019-07-17 13:08:48.909  INFO 93052 --- [       Thread-4] i.m.c.i.logging.LoggingMeterRegistry     : cache.remoteSize{} value=0
2019-07-17 13:08:48.909  INFO 93052 --- [trics-publisher] i.m.c.i.logging.LoggingMeterRegistry     : cache.remoteSize{} value=0
2019-07-17 13:08:48.909  INFO 93052 --- [       Thread-4] i.m.c.i.logging.LoggingMeterRegistry     : cache.size{cache=playCache,cacheManager=cacheManager,name=playCache} value=7
2019-07-17 13:08:48.909  INFO 93052 --- [trics-publisher] i.m.c.i.logging.LoggingMeterRegistry     : cache.size{cache=playCache,cacheManager=cacheManager,name=playCache} value=7
在这种情况下,指标上下文中每个组件的职责可归纳为:
您可以在 此处 提供的示例应用中查看所有这些概念。
编码快乐!
原文:https://dzone.com/articles/spring-boot-where-do-the-default-metrics-come-from
作者:Dawid Kublik
译者:Queena
8月福利准时来袭,关注公众号
后台回复:003即可领取7月翻译集锦哦~
往期福利回复:001,002即可领取!